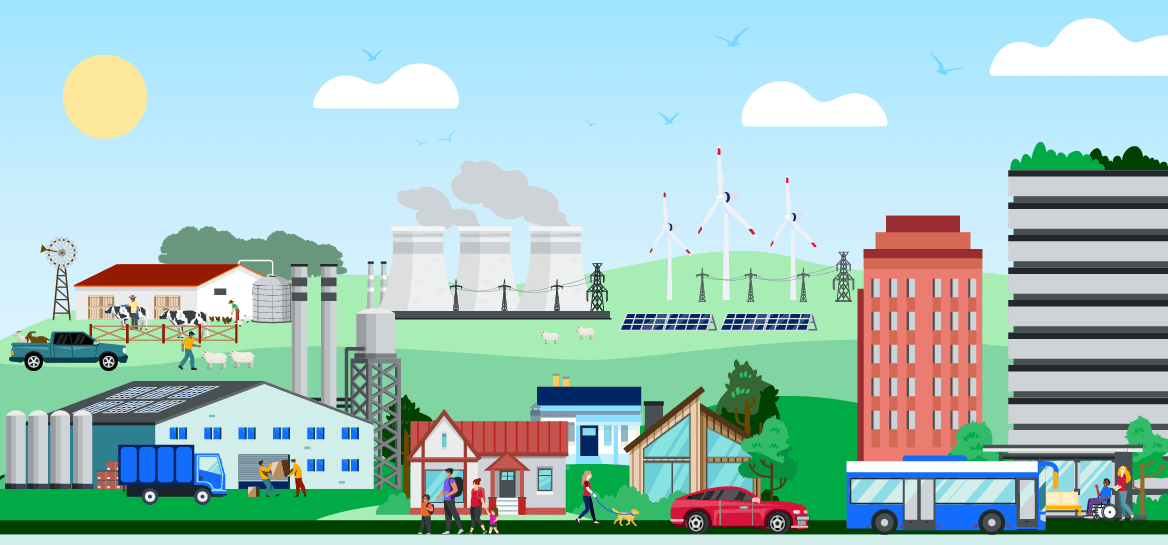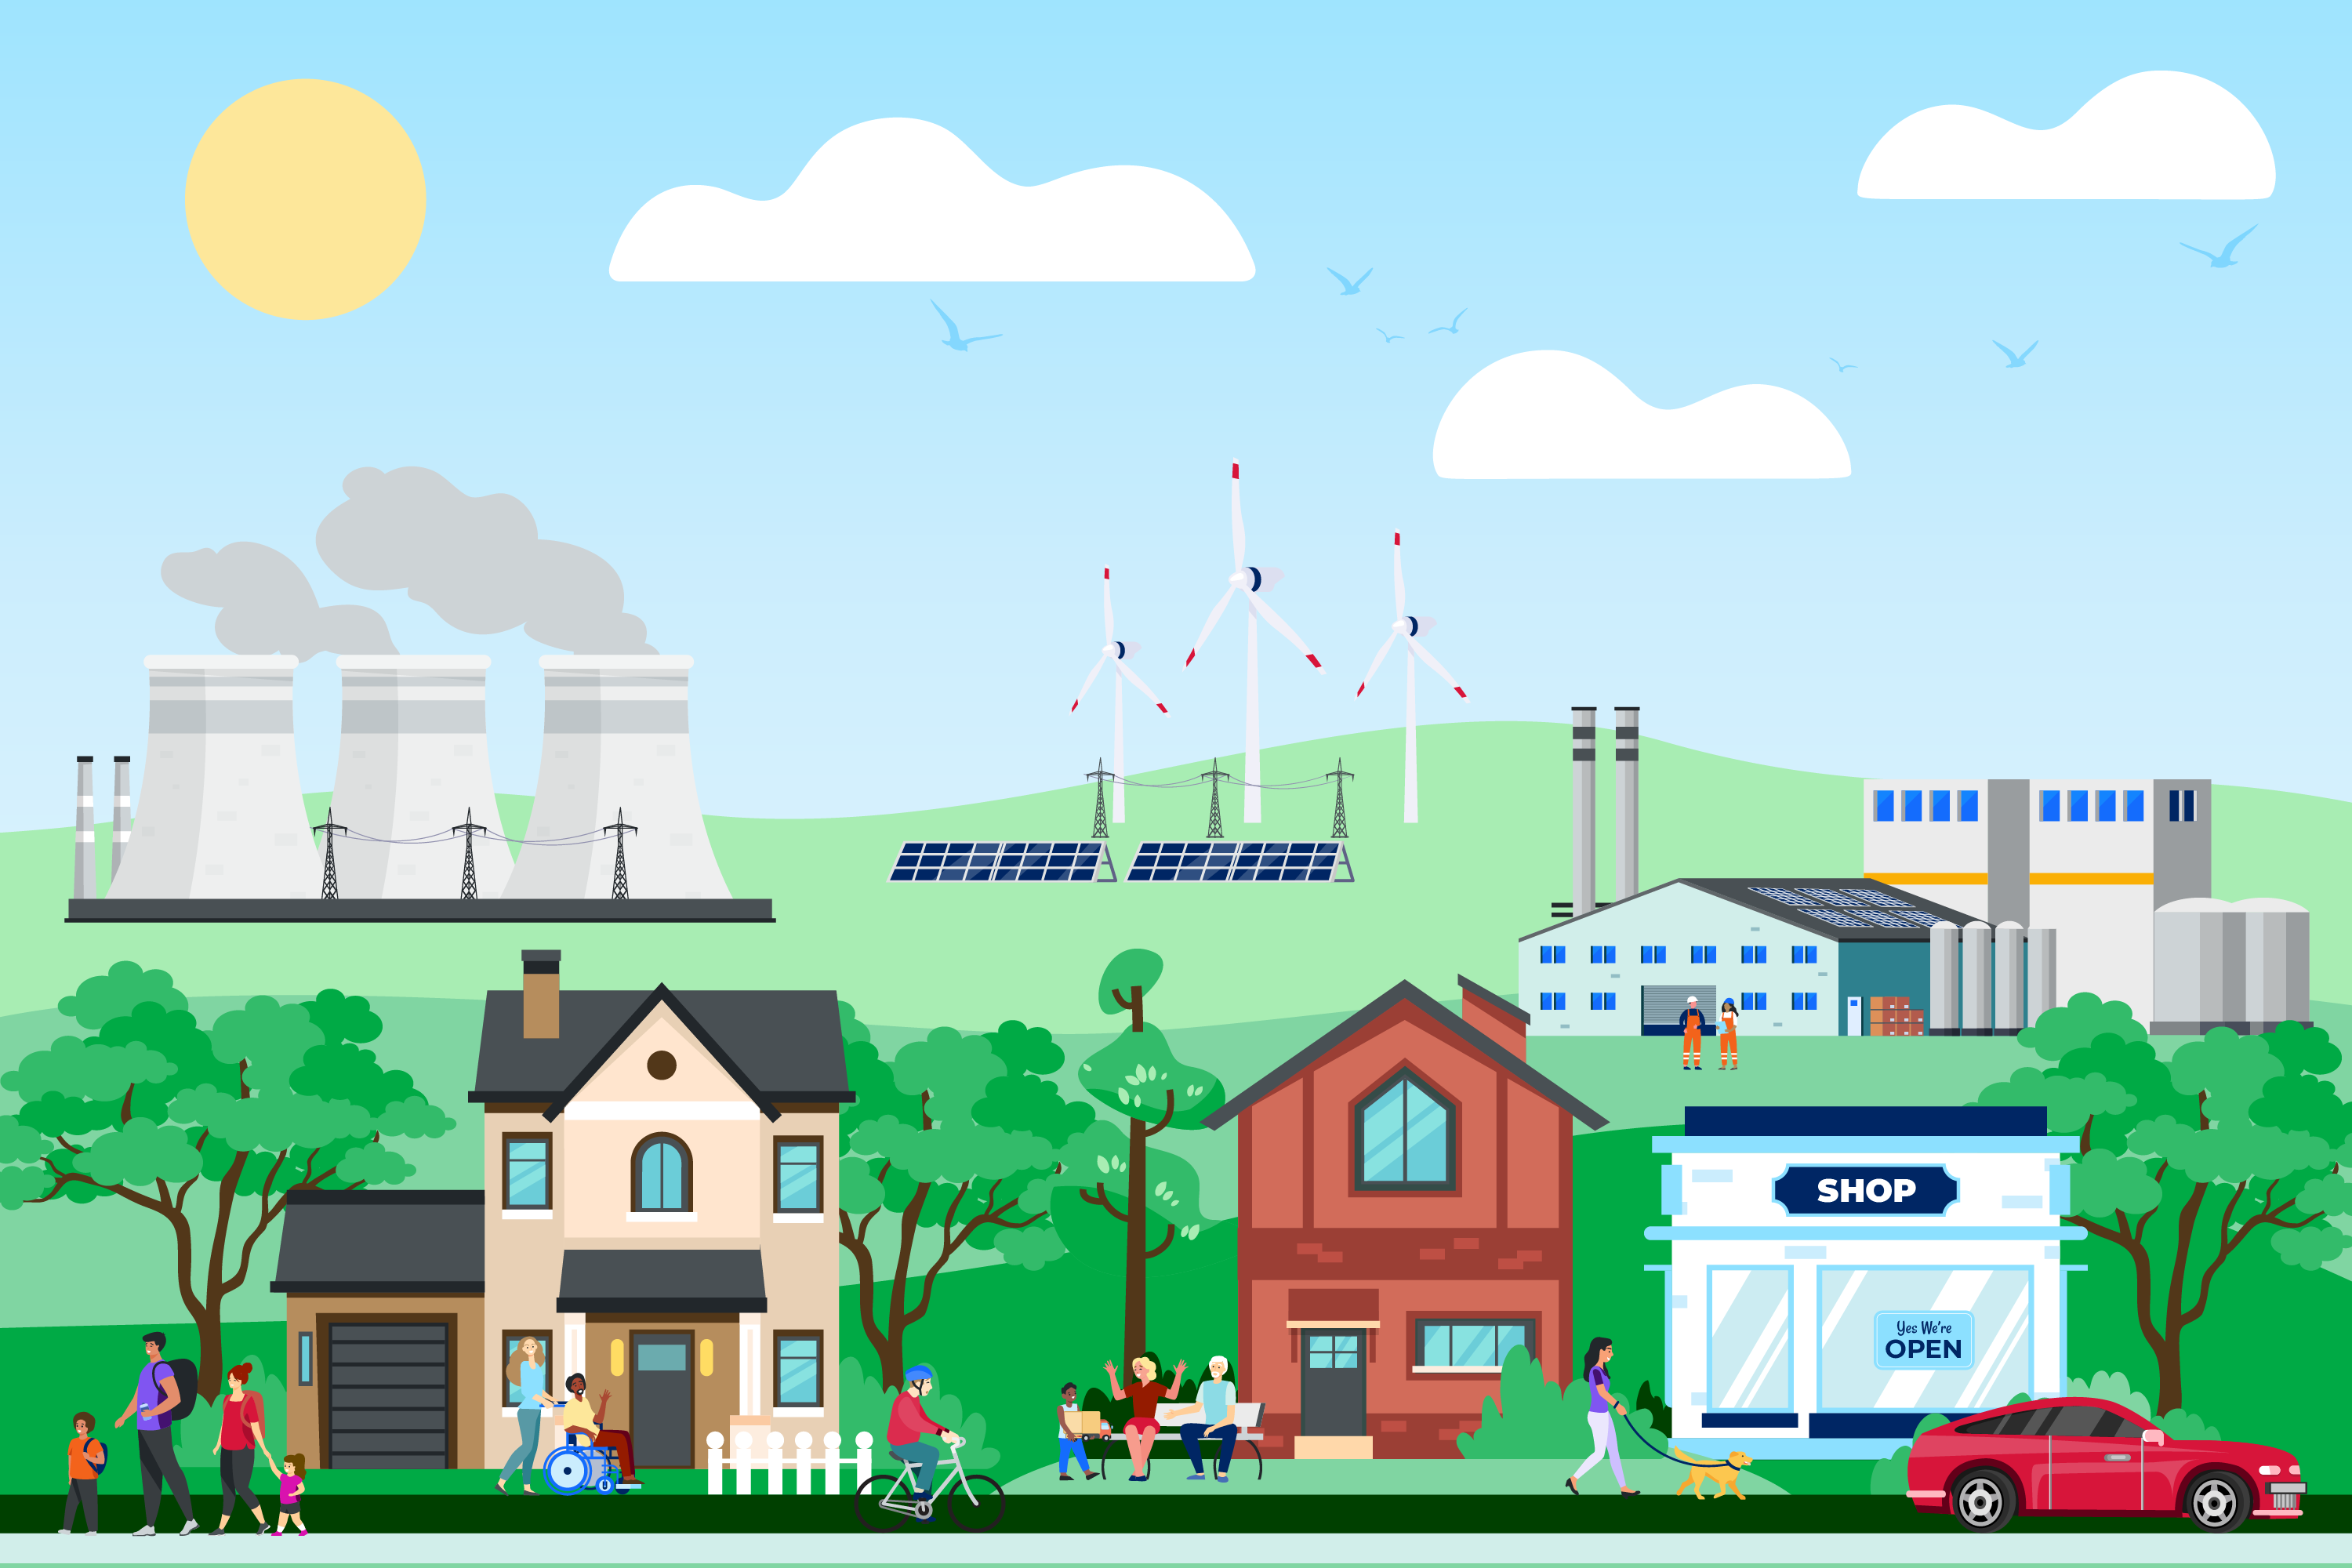
Emissions are the greenhouse gases we release into the atmosphere. Nearly everything we do produces emissions. The choices we make in our everyday lives determine how many emissions we produce and the impact this has on the environment.
Emissions and the greenhouse effect
As the name suggests, our atmosphere works like a greenhouse, trapping heat from the sun during the day and holding it in to keep us warm at night.
These gases are essential for life on earth. The best known greenhouse gases are water vapour and carbon dioxide. But there's a variety of different gases with different sources and impacts. These gases move in natural cycles that control earth's climate.

When we burn fossil fuels, we add more greenhouse gases into the atmosphere. As these emissions build up, they disrupt the natural balance, trapping more and more heat in our greenhouse.
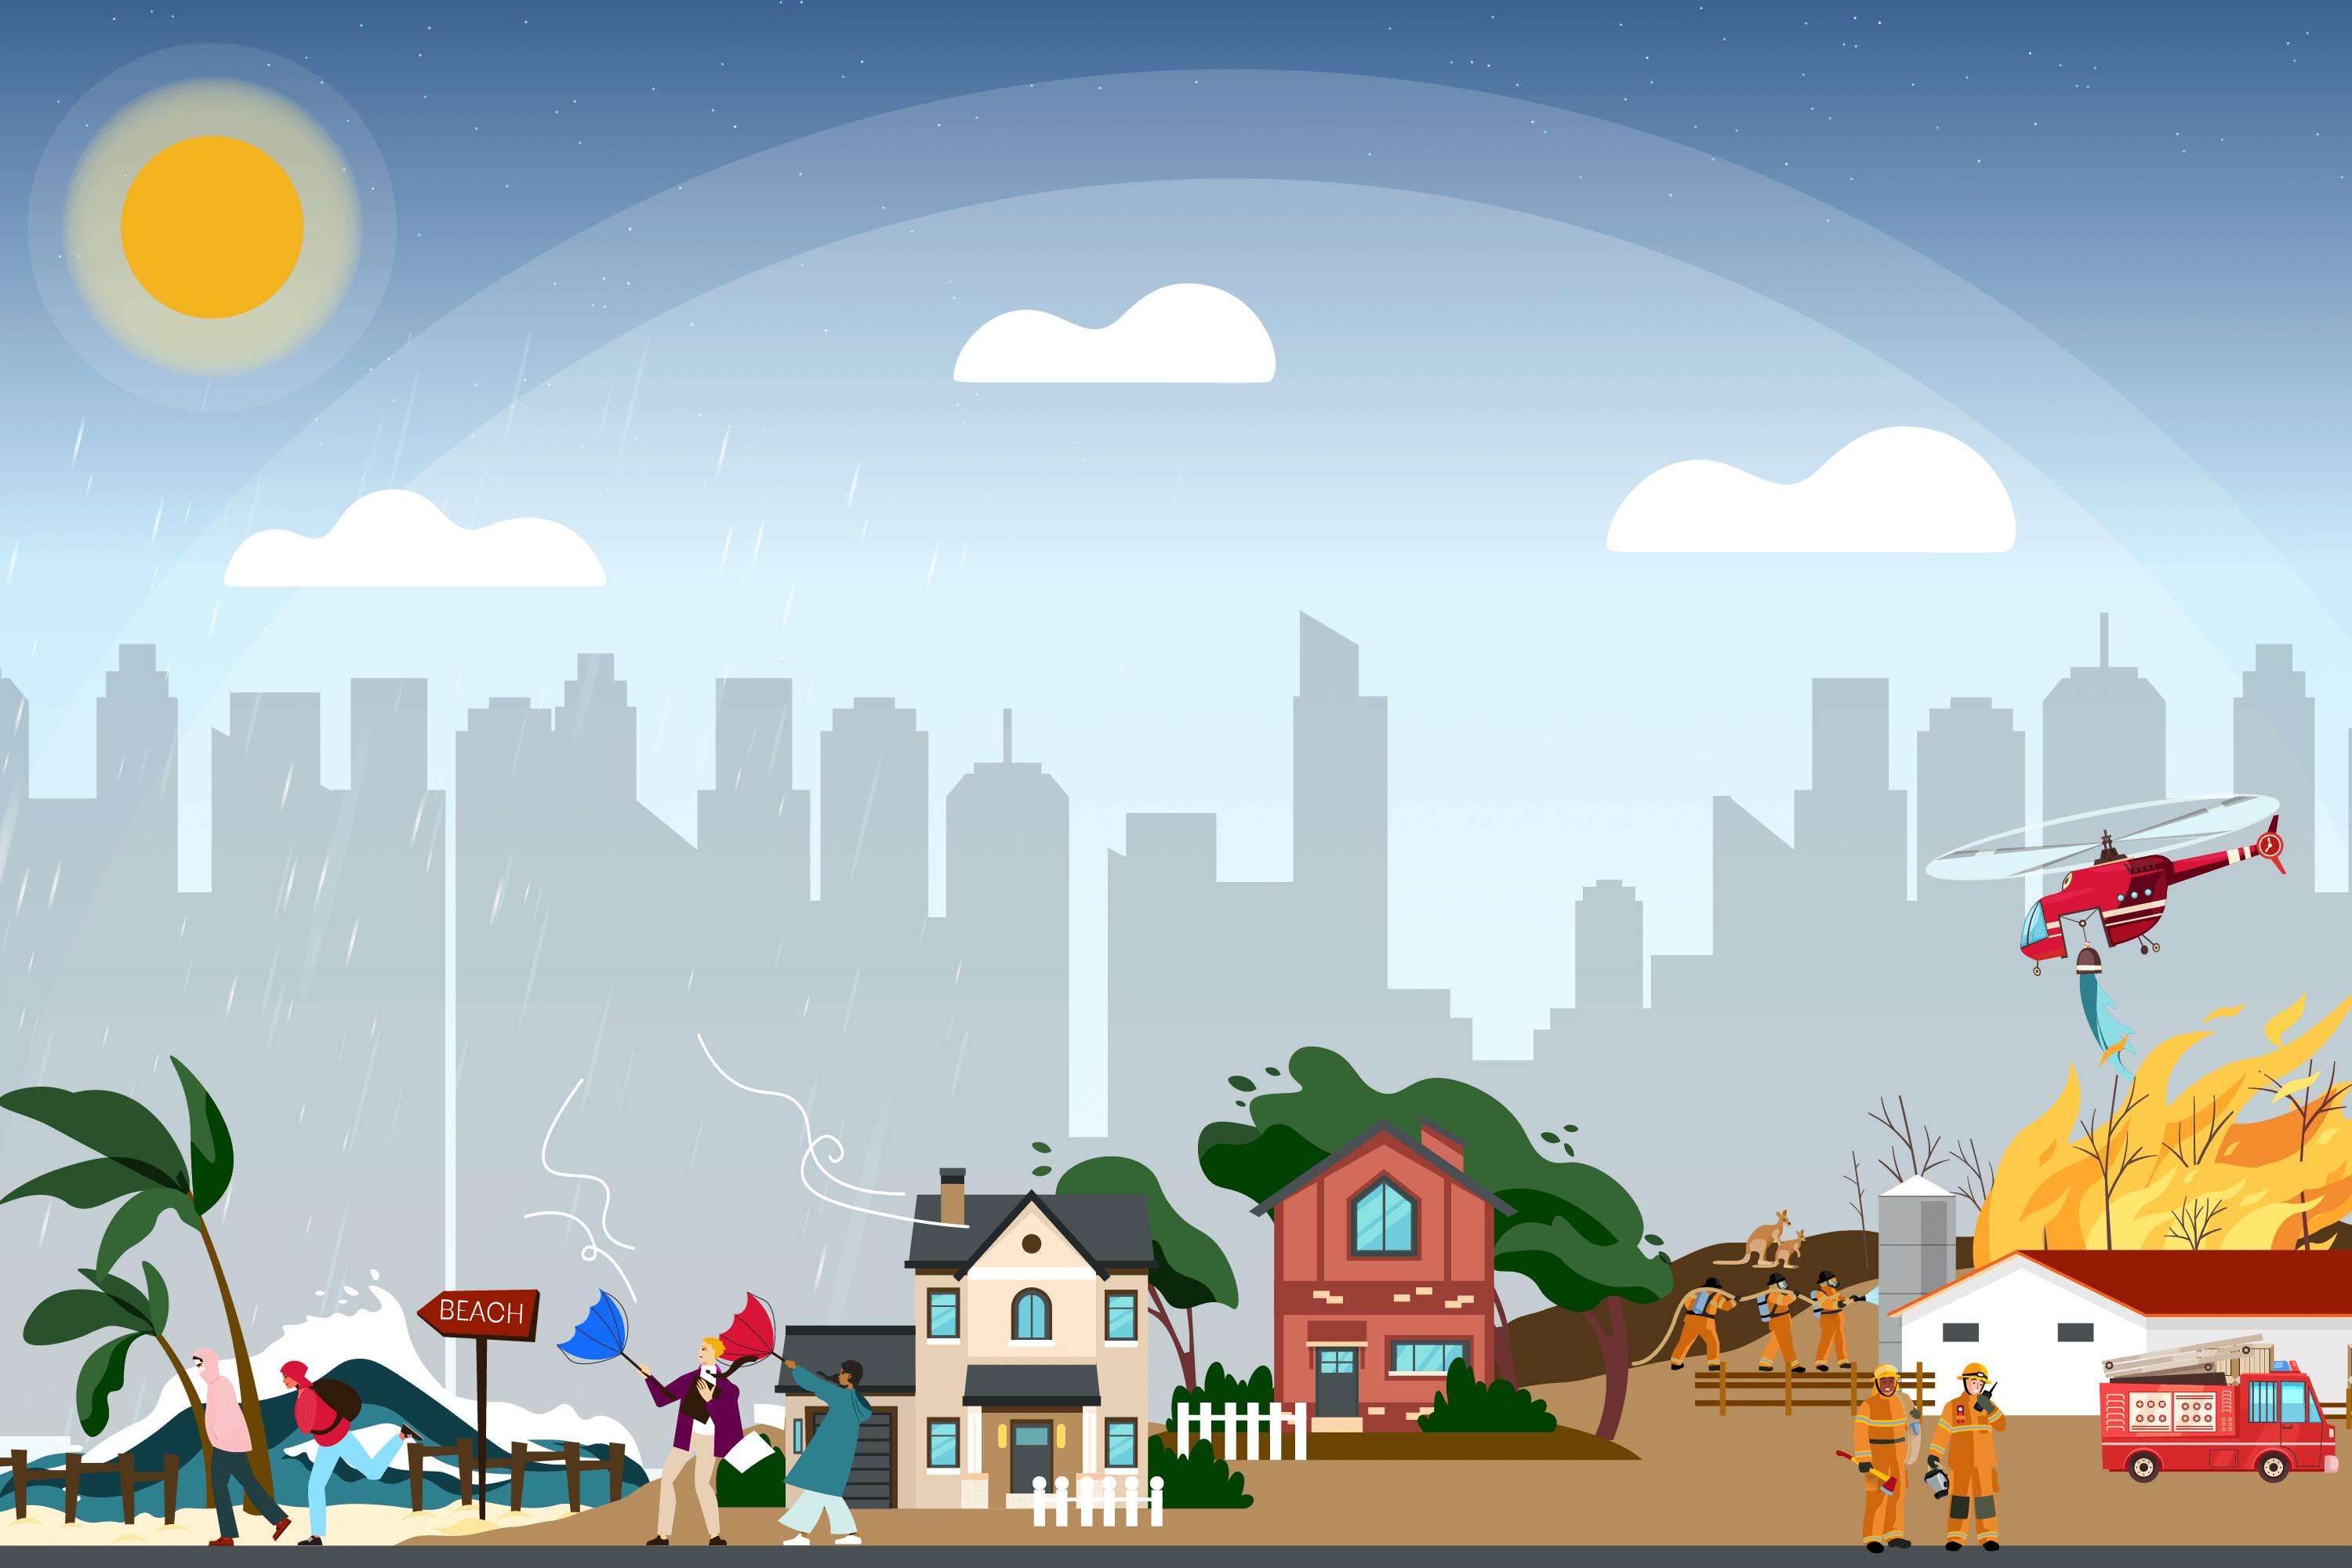
This causes extreme weather, rising sea levels, and plant and animal extinctions, threatening our homes, food supplies and our lives and disrupting those natural cycles. Climate change is already happening, but we can reduce the impacts by working towards net zero.
Our ‘net’ emissions
We calculate emissions compared to the potential they have to warm the planet compared to carbon dioxide over 100 years. So, they are usually expressed as ‘carbon dioxide equivalents’ (CO2e).
We determine the amount of direct emissions that can be attributed to NSW in line with the Australian National Greenhouse Accounts.
According to the 2022 National Greenhouse Accounts, our net total of greenhouse gas emissions is 111 million tonnes of carbon dioxide equivalent (MtCO2e) a year.
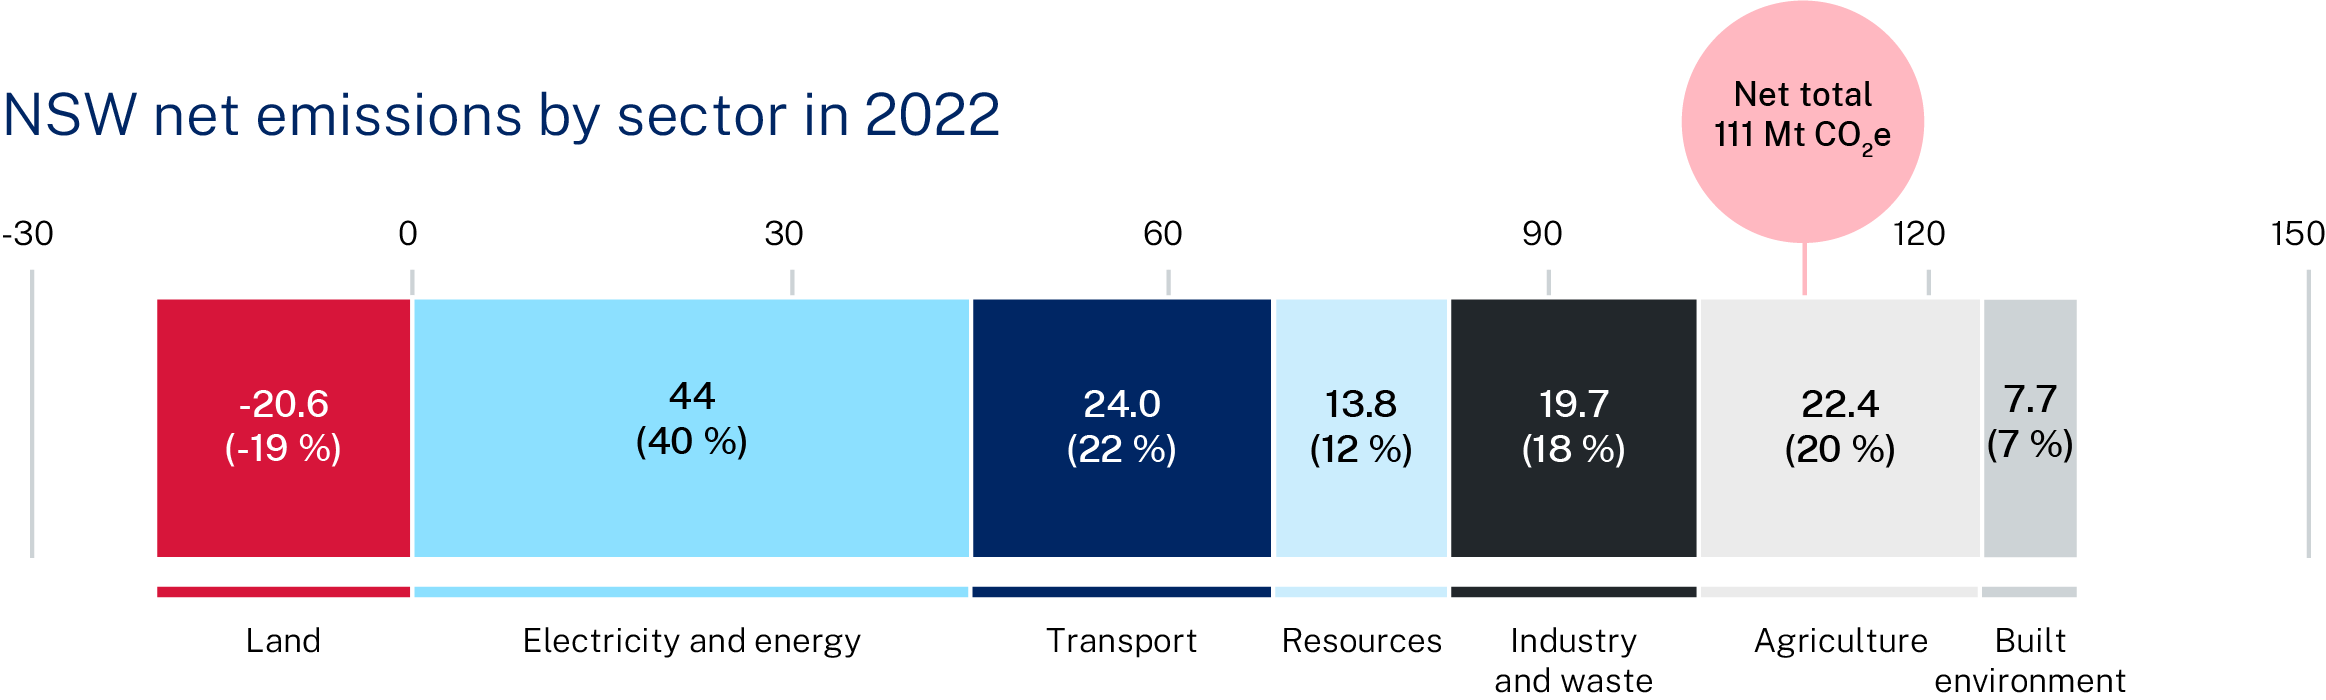
- 40% of emissions come from the energy sector, (44 MtCO2e).
- 22% of emissions come from transport, (24 MtCO2e).
- 20% of emissions come from agriculture, (22.4 MtCO2e).
- 14% of emissions come from industrial processes, (15 MtCO2e).
- 4% of emissions come from waste management, (4.7 MtCO2e).
- 7% of emissions come from the built environment, (7.7 MtCO2e).
- These total (131.6 MtCO2e minus 20.6).The land sector actually reduces emissions by 19%. That's about 20.6 MtCO2e a year. This gives us the net total of 111 MtCO2e.
To achieve our net zero targets, NSW’s net emissions must be zero or negative by 2050.
Emissions sources and impacts
To reduce the impacts of different emissions, we need to understand where they come from. That way we can tackle emissions at the source.
There are 5 types of emissions (or greenhouse gases) mentioned in the Climate Change (Net Zero Future) Act 2023 that we need to reduce. Their impact depends on:
- how much of it there is
- how long it stays in the atmosphere
- how much it absorbs the sun's radiation.
Carbon dioxide
Carbon dioxide (CO2) contributes about 64% of NSW's total greenhouse gas emissions. Since the Industrial Revolution, the amount of CO2 in the world has increased by more than 50%.
Carbon dioxide is so prevalent that we talk about all greenhouse gases in tonnes of carbon dioxide equivalent (CO2e).
Impact of CO2
While CO2 production is finally trending down as we reduce our use of fossil fuels, CO2 stays in the atmosphere for up to 1,000 years. For this reason, researchers around the world are actively investigating new technologies to reduce the amount of CO2 already in the atmosphere.
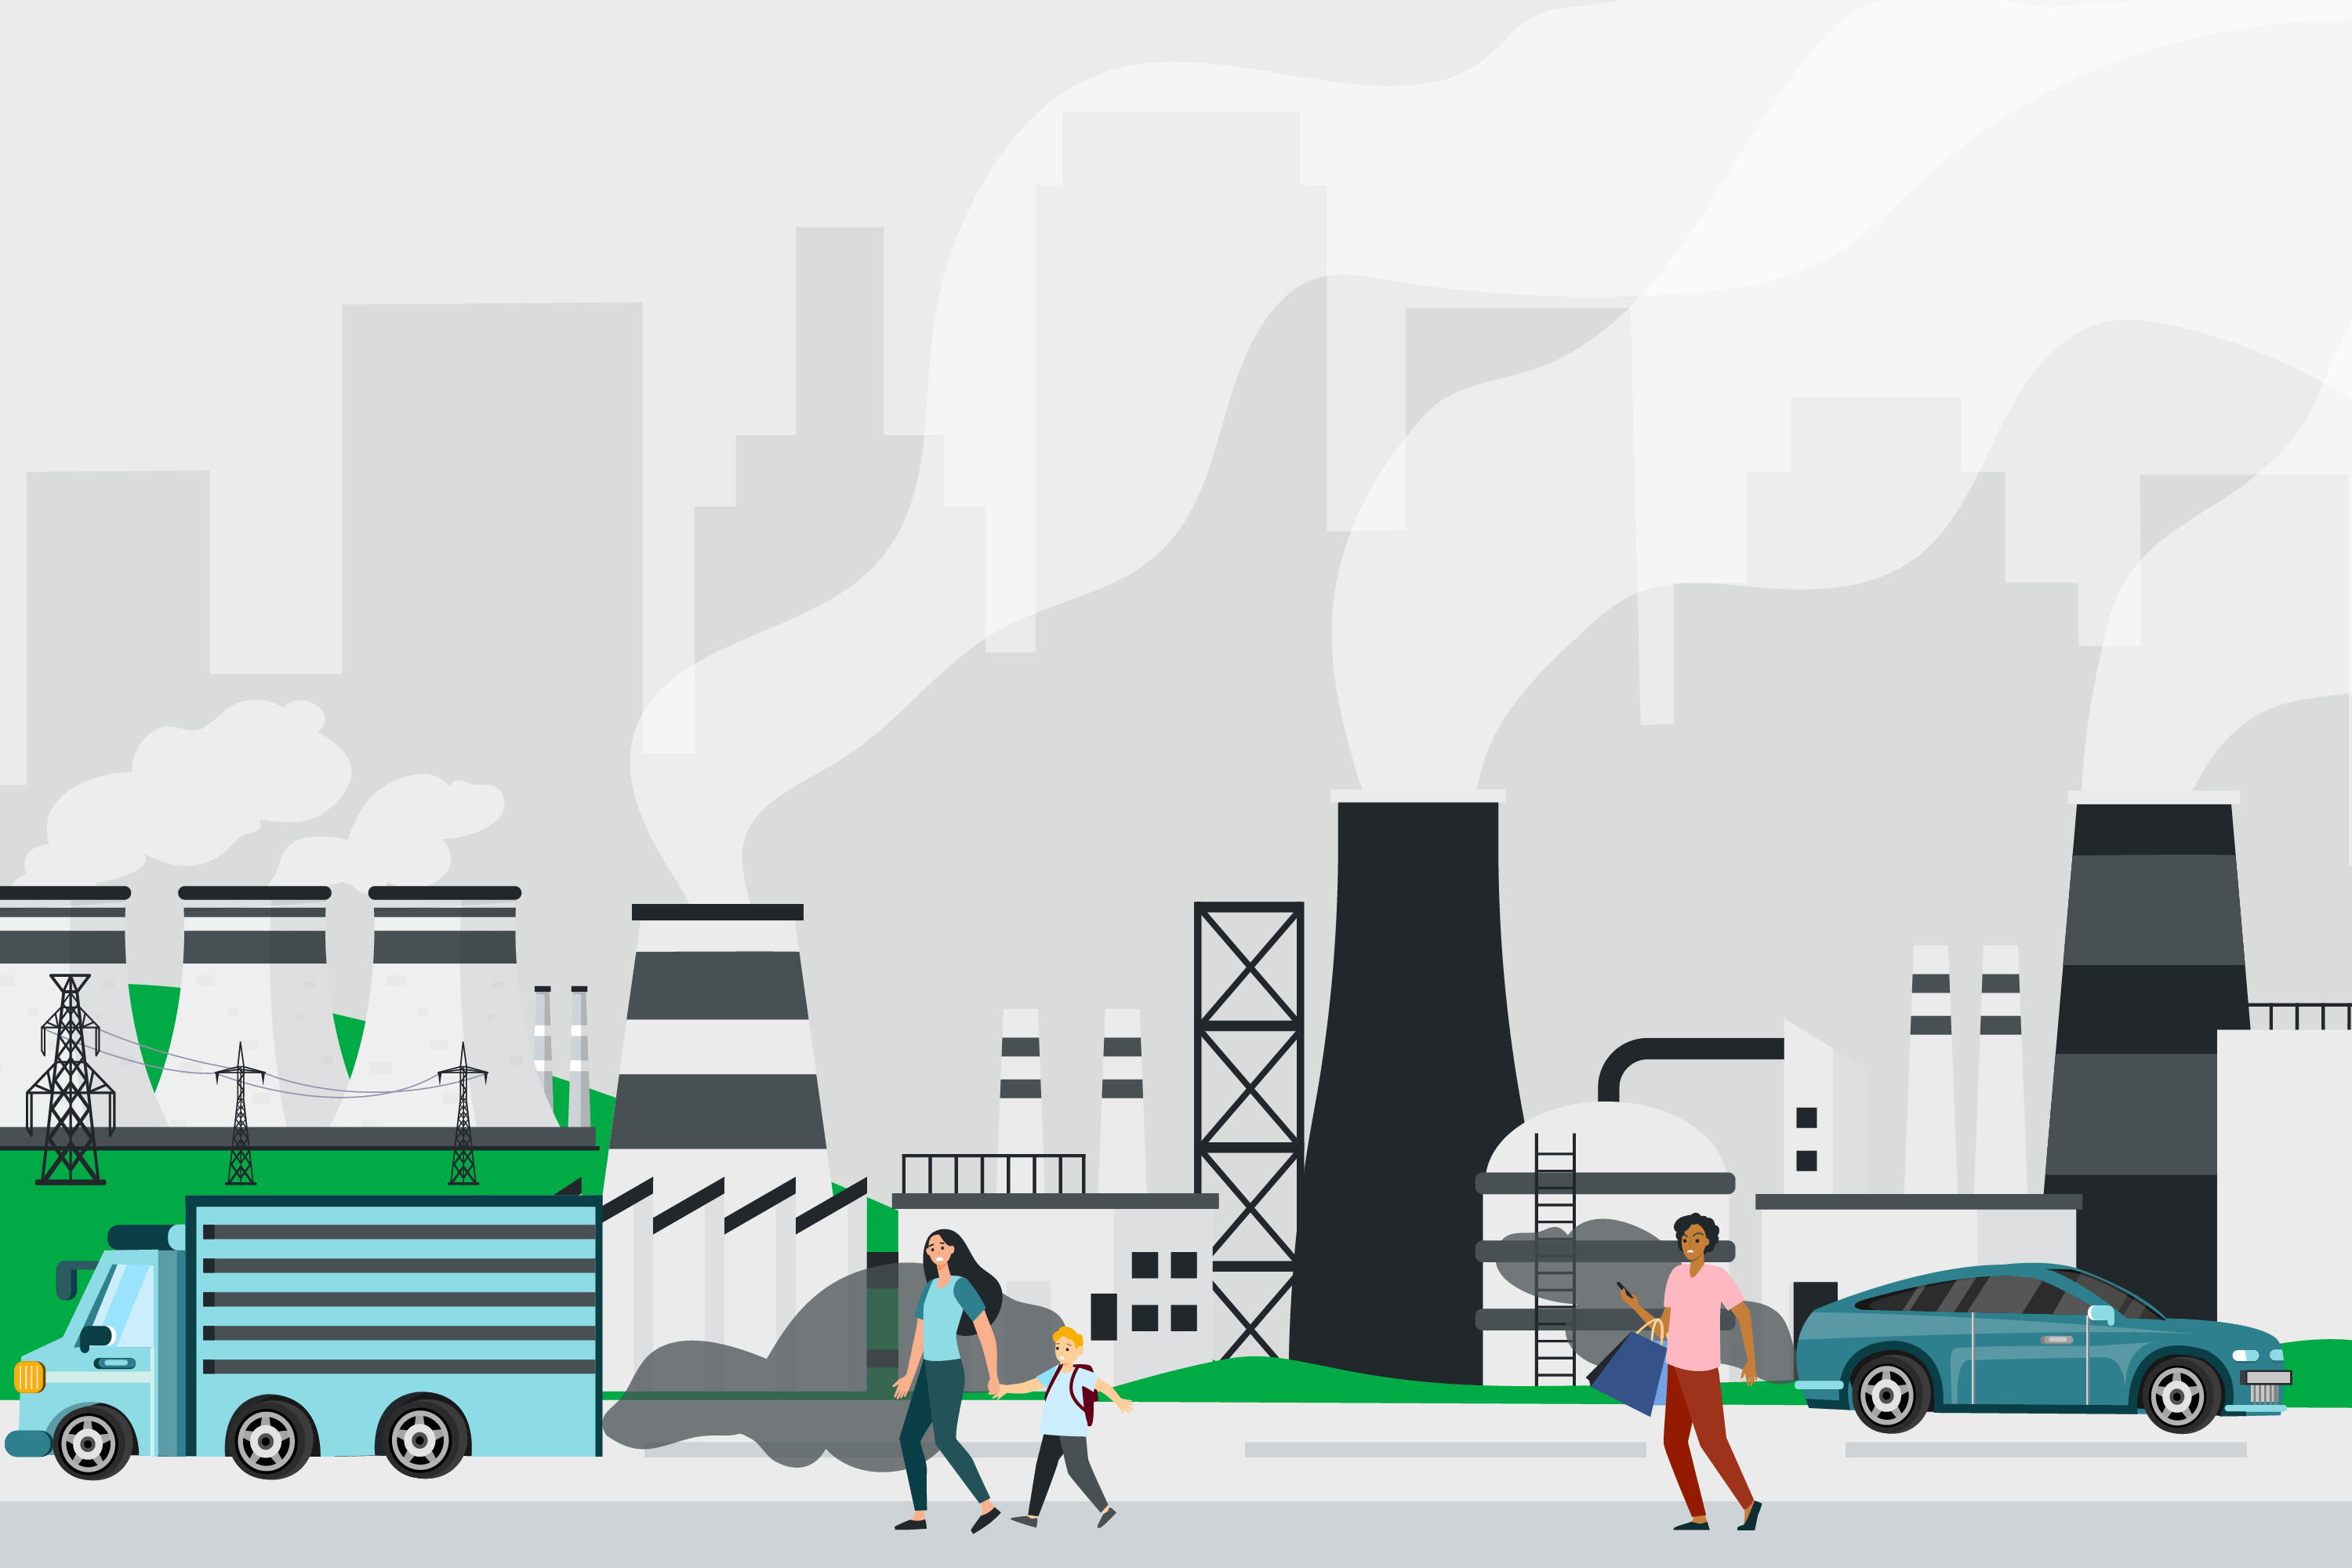
Source of CO2
About 90% of the world’s CO2 emissions come from the burning of fossil fuels, particularly for producing energy. Other sources are transport, agriculture and industry.
Methane
Methane (CH4) contributes about 29% of NSW emissions. It isn’t as prevalent as carbon dioxide, but absorbs 20 times more radiation.
Impact of CH4
Methane moves through the atmosphere much faster than carbon dioxide, taking about 12 years to move through the atmosphere.
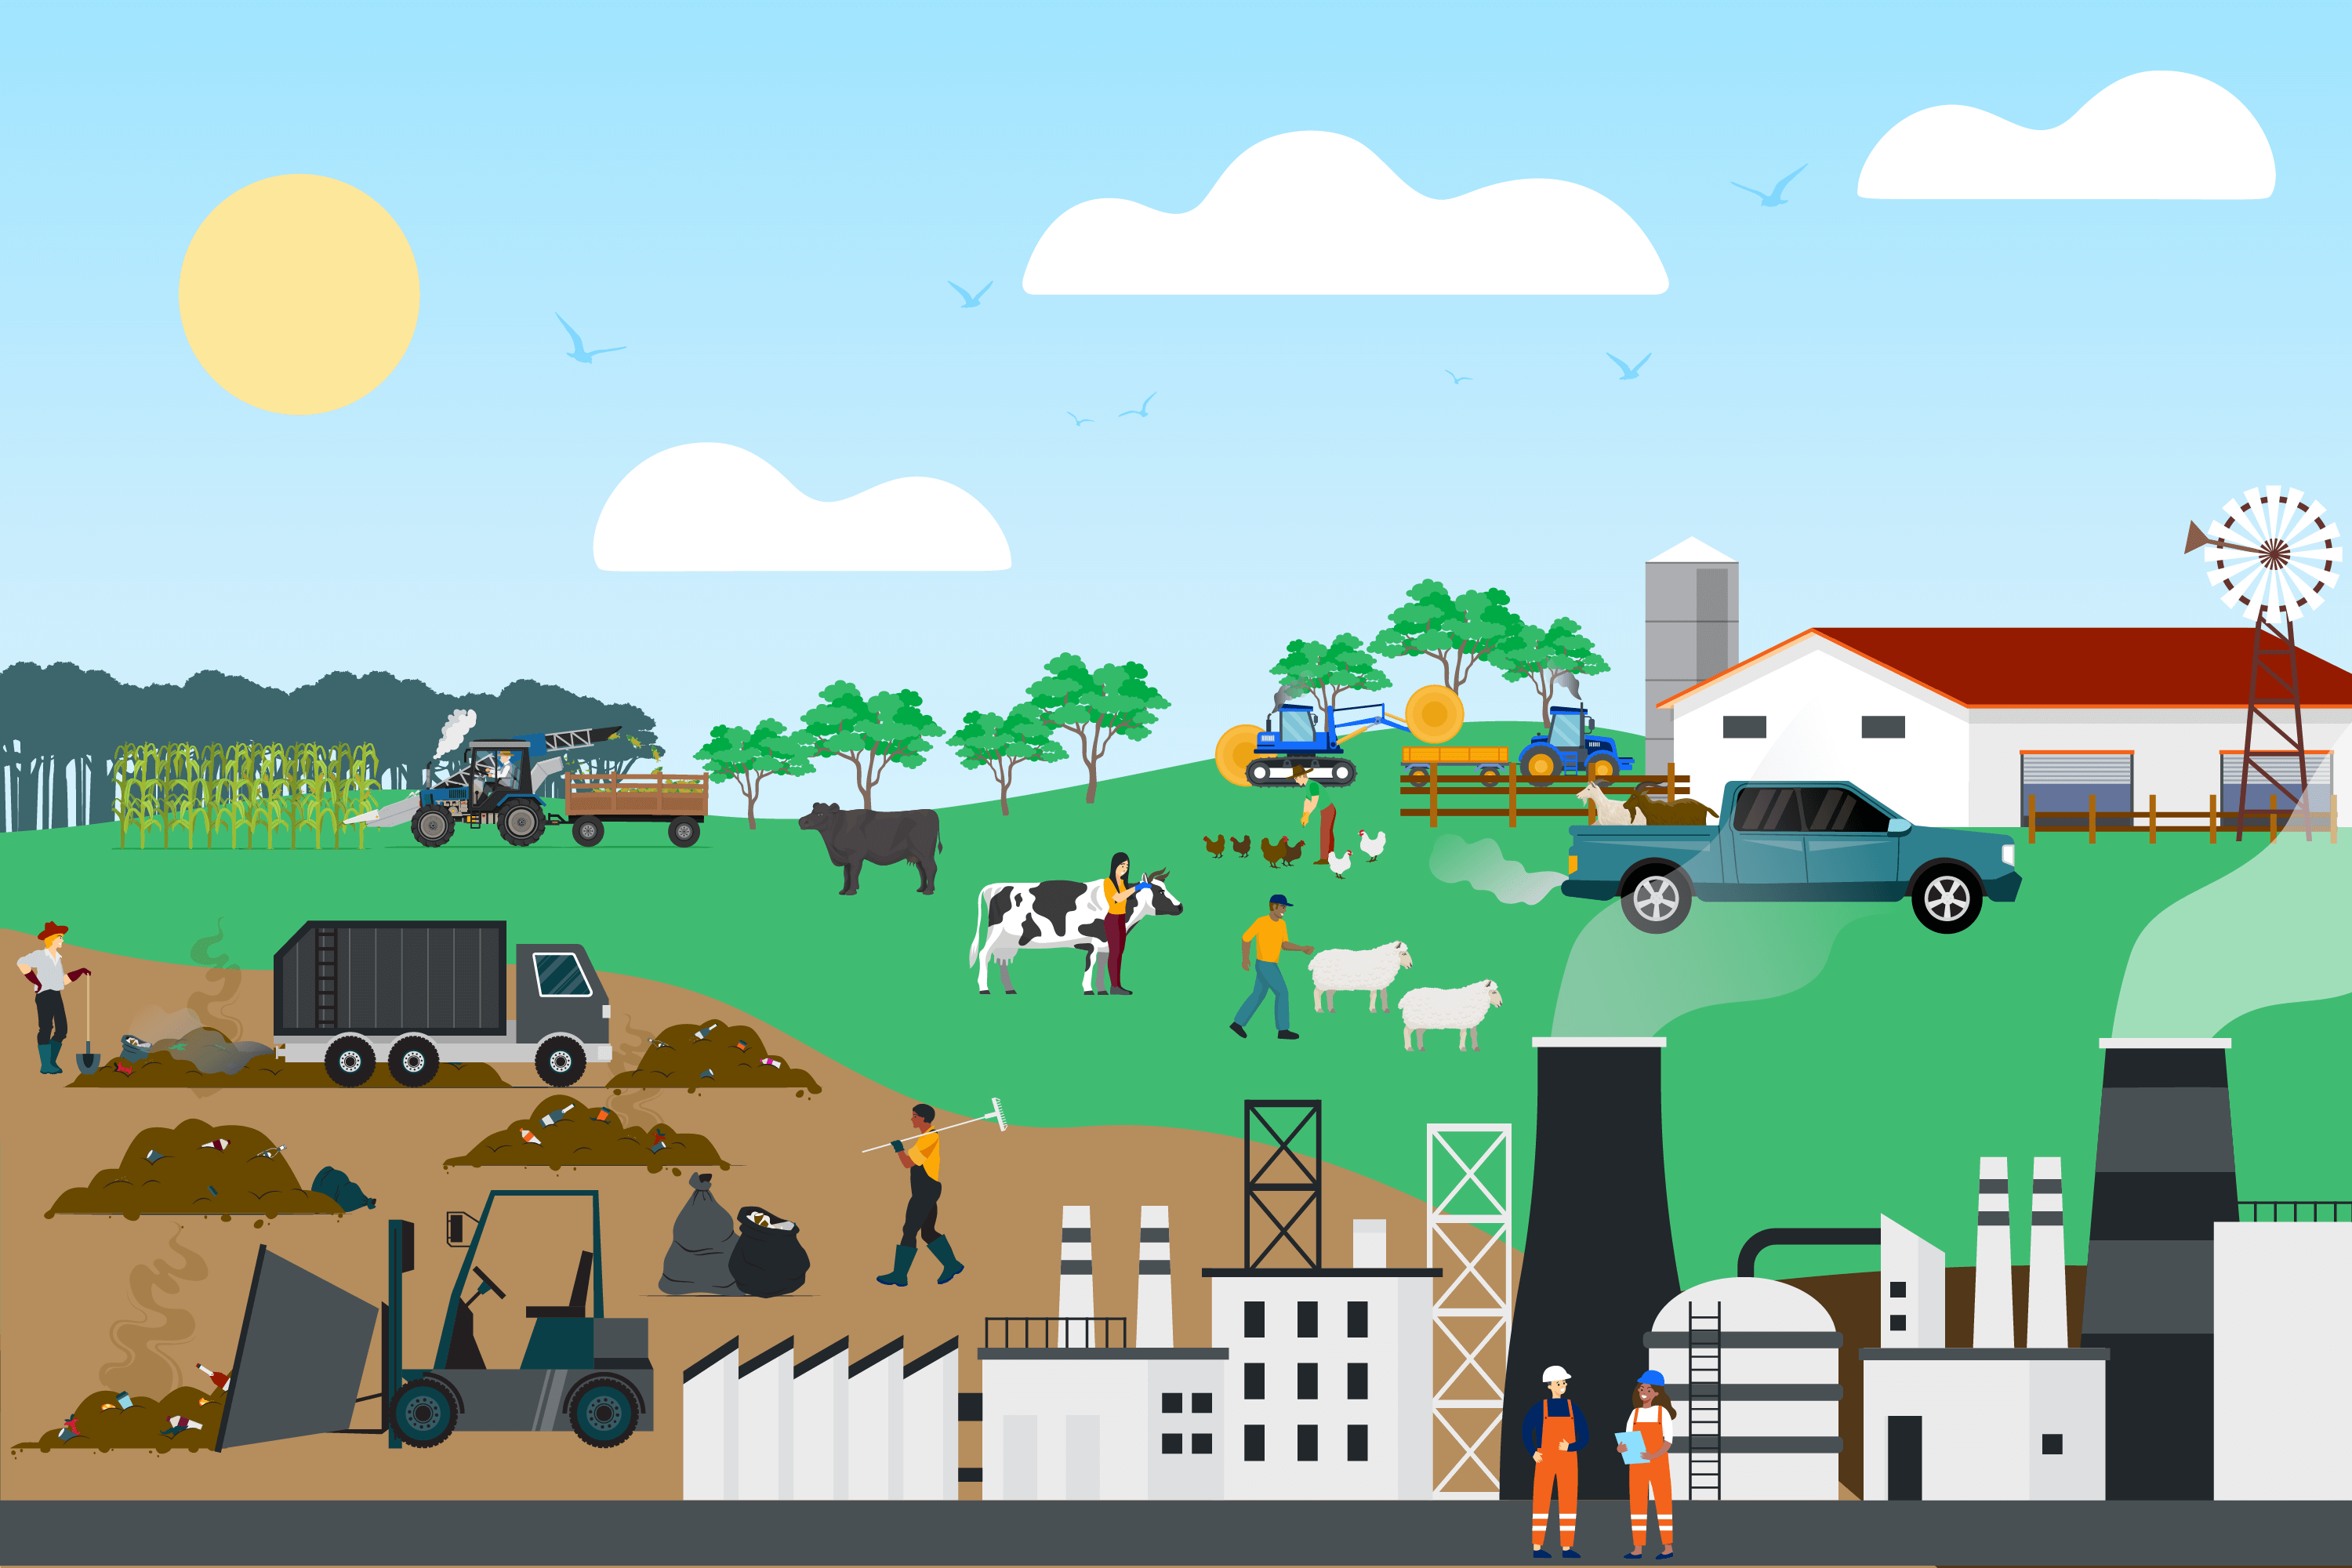
Sources of methane
Major sources of methane include livestock, farming (about 40%), fossil fuel production (35%) and waste management (20%).
Nitrous oxide
Nitrous oxide (N2O) contributes about 4% of NSW emissions.
Impact of N2O
N2O is known for its role in motor sports or as laughing gas from its medical uses. But it’s no laughing matter, as it traps about 260 times more heat in the atmosphere than carbon dioxide. It’s also believed to thin the ozone layer.
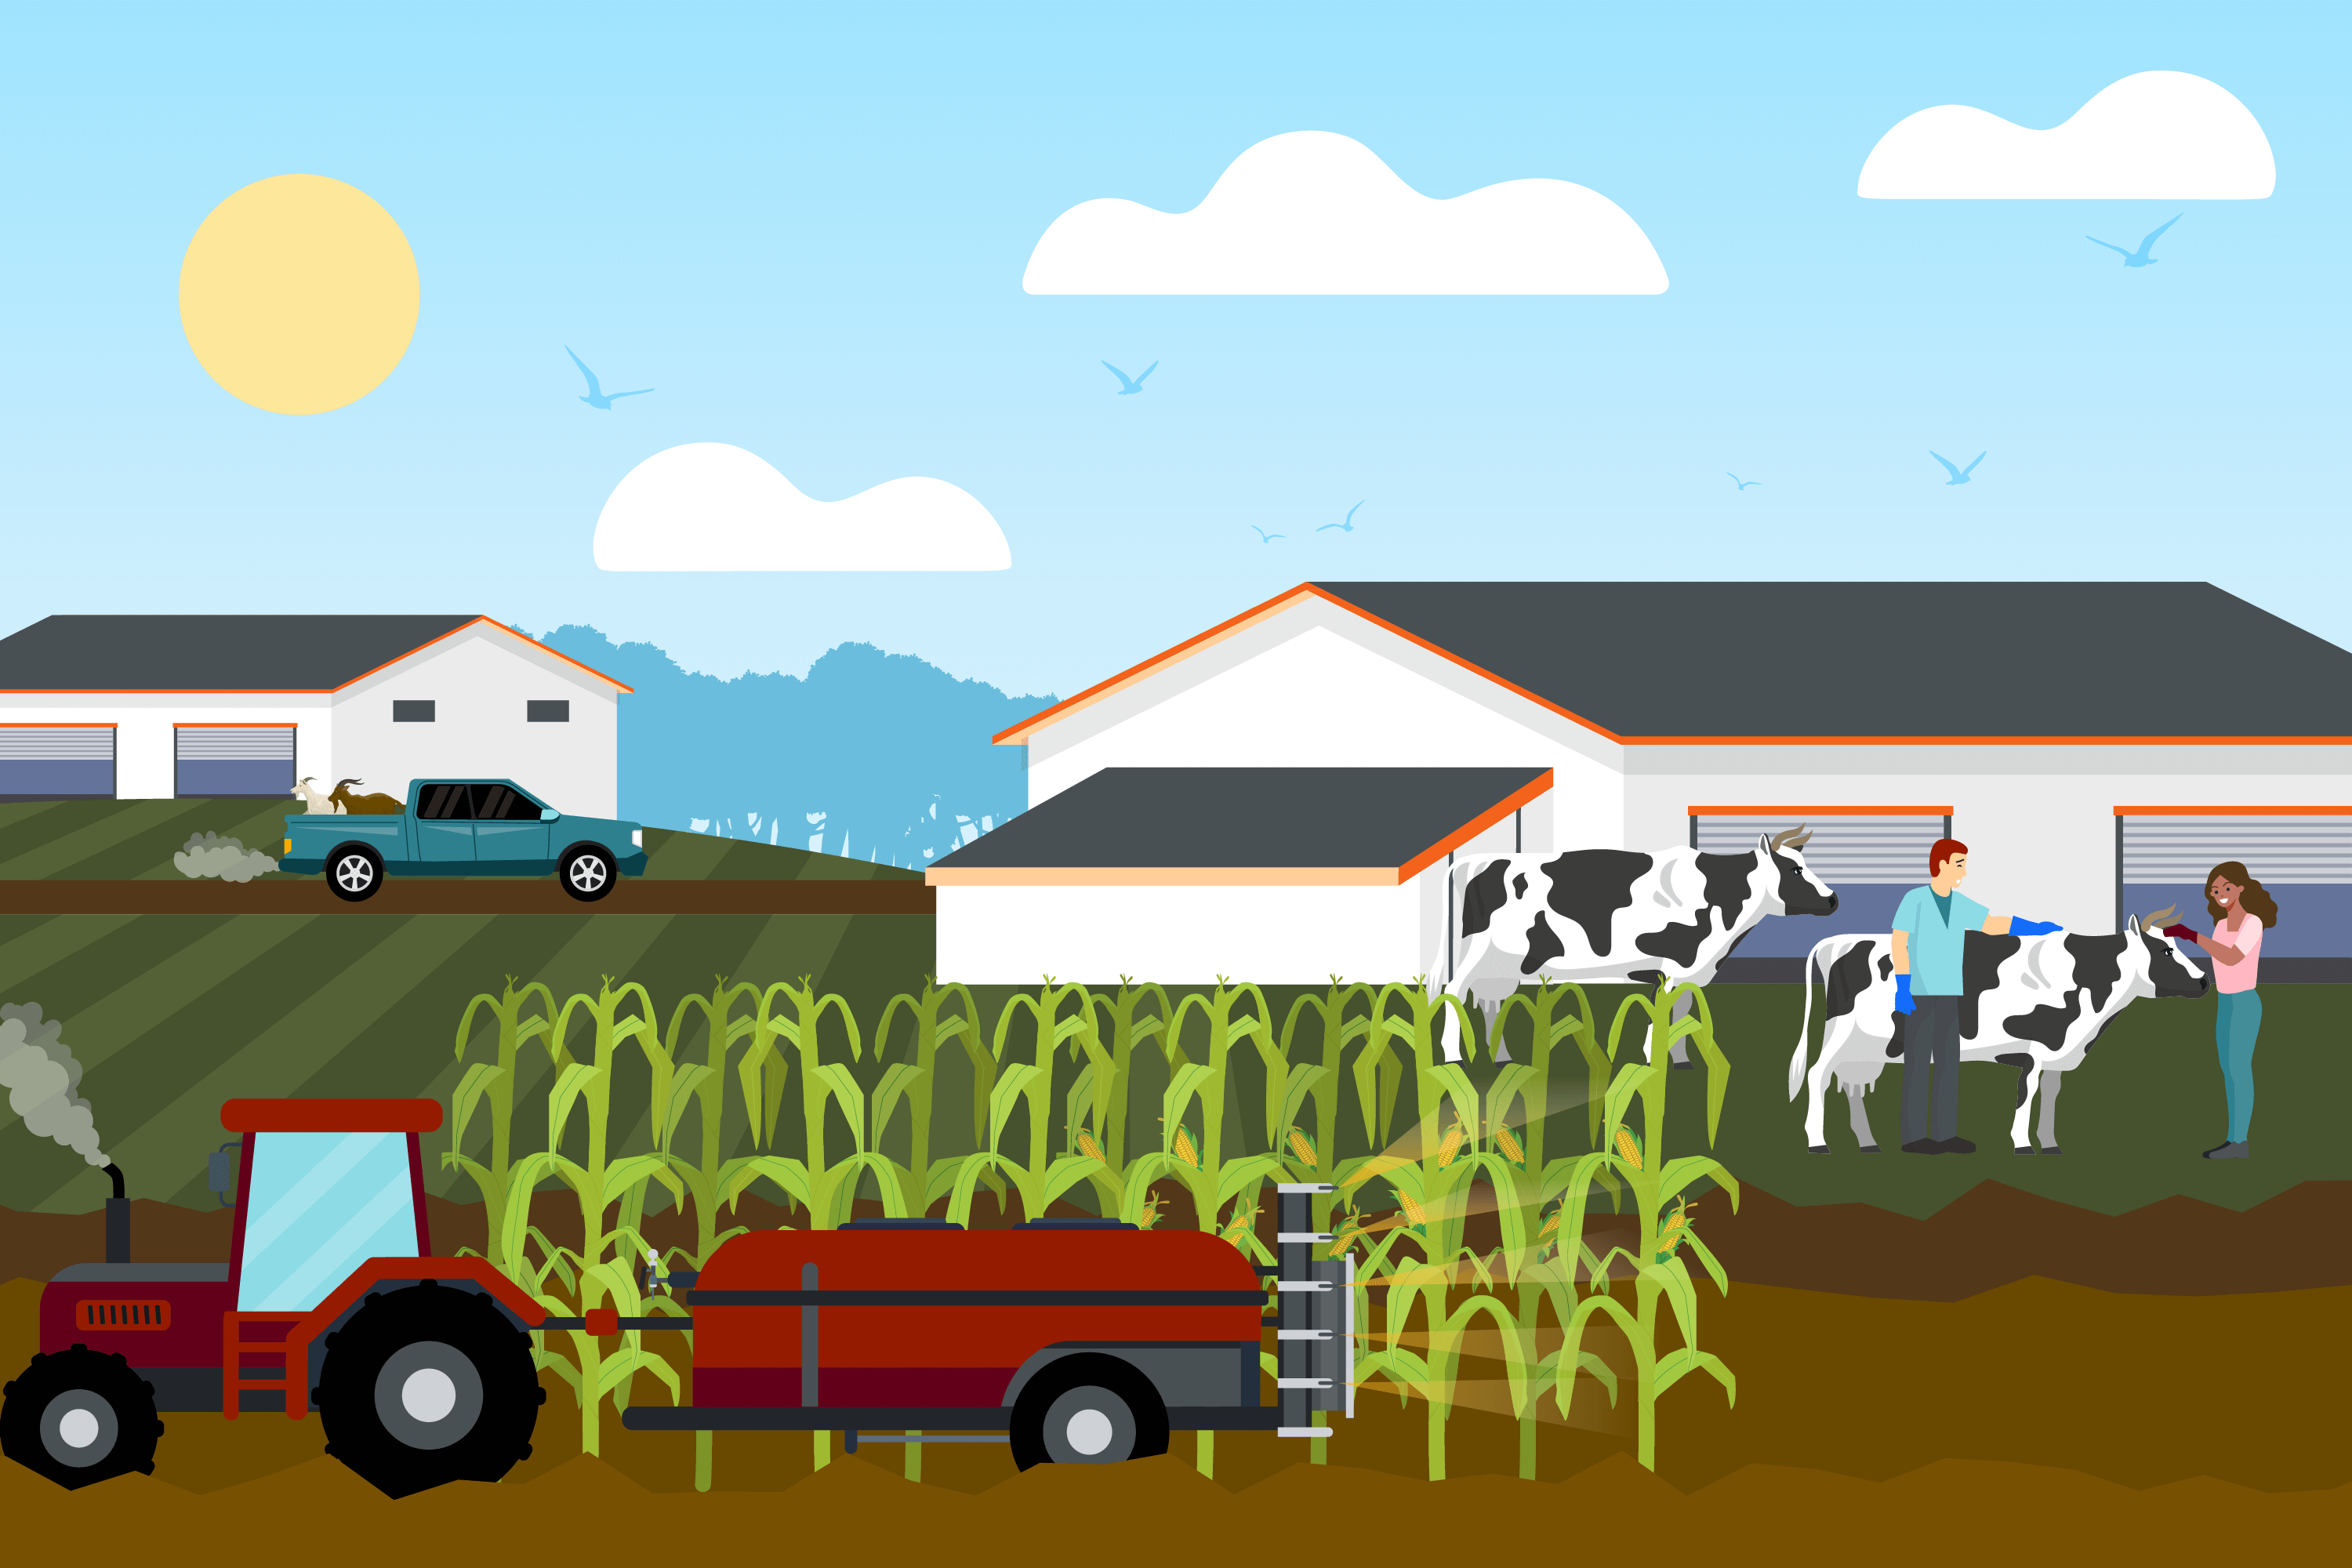
Source of nitrous oxide
About 40% of the nitrogen in the atmosphere comes from human activity, mainly from fertiliser and animal manure.
Fluorinated gases
Fluorinated gases include perfluorocarbons (PFCs) and hydrofluorocarbons (HFCs).
Together with sulphur hexafluoride, these gases contribute about 3% of NSW emissions.
Impact of PFCs and HFCs
Although not as common as carbon dioxide, these gases remain in the atmosphere for about 50,000 years and have thousands of times more potential for absorbing radiation.
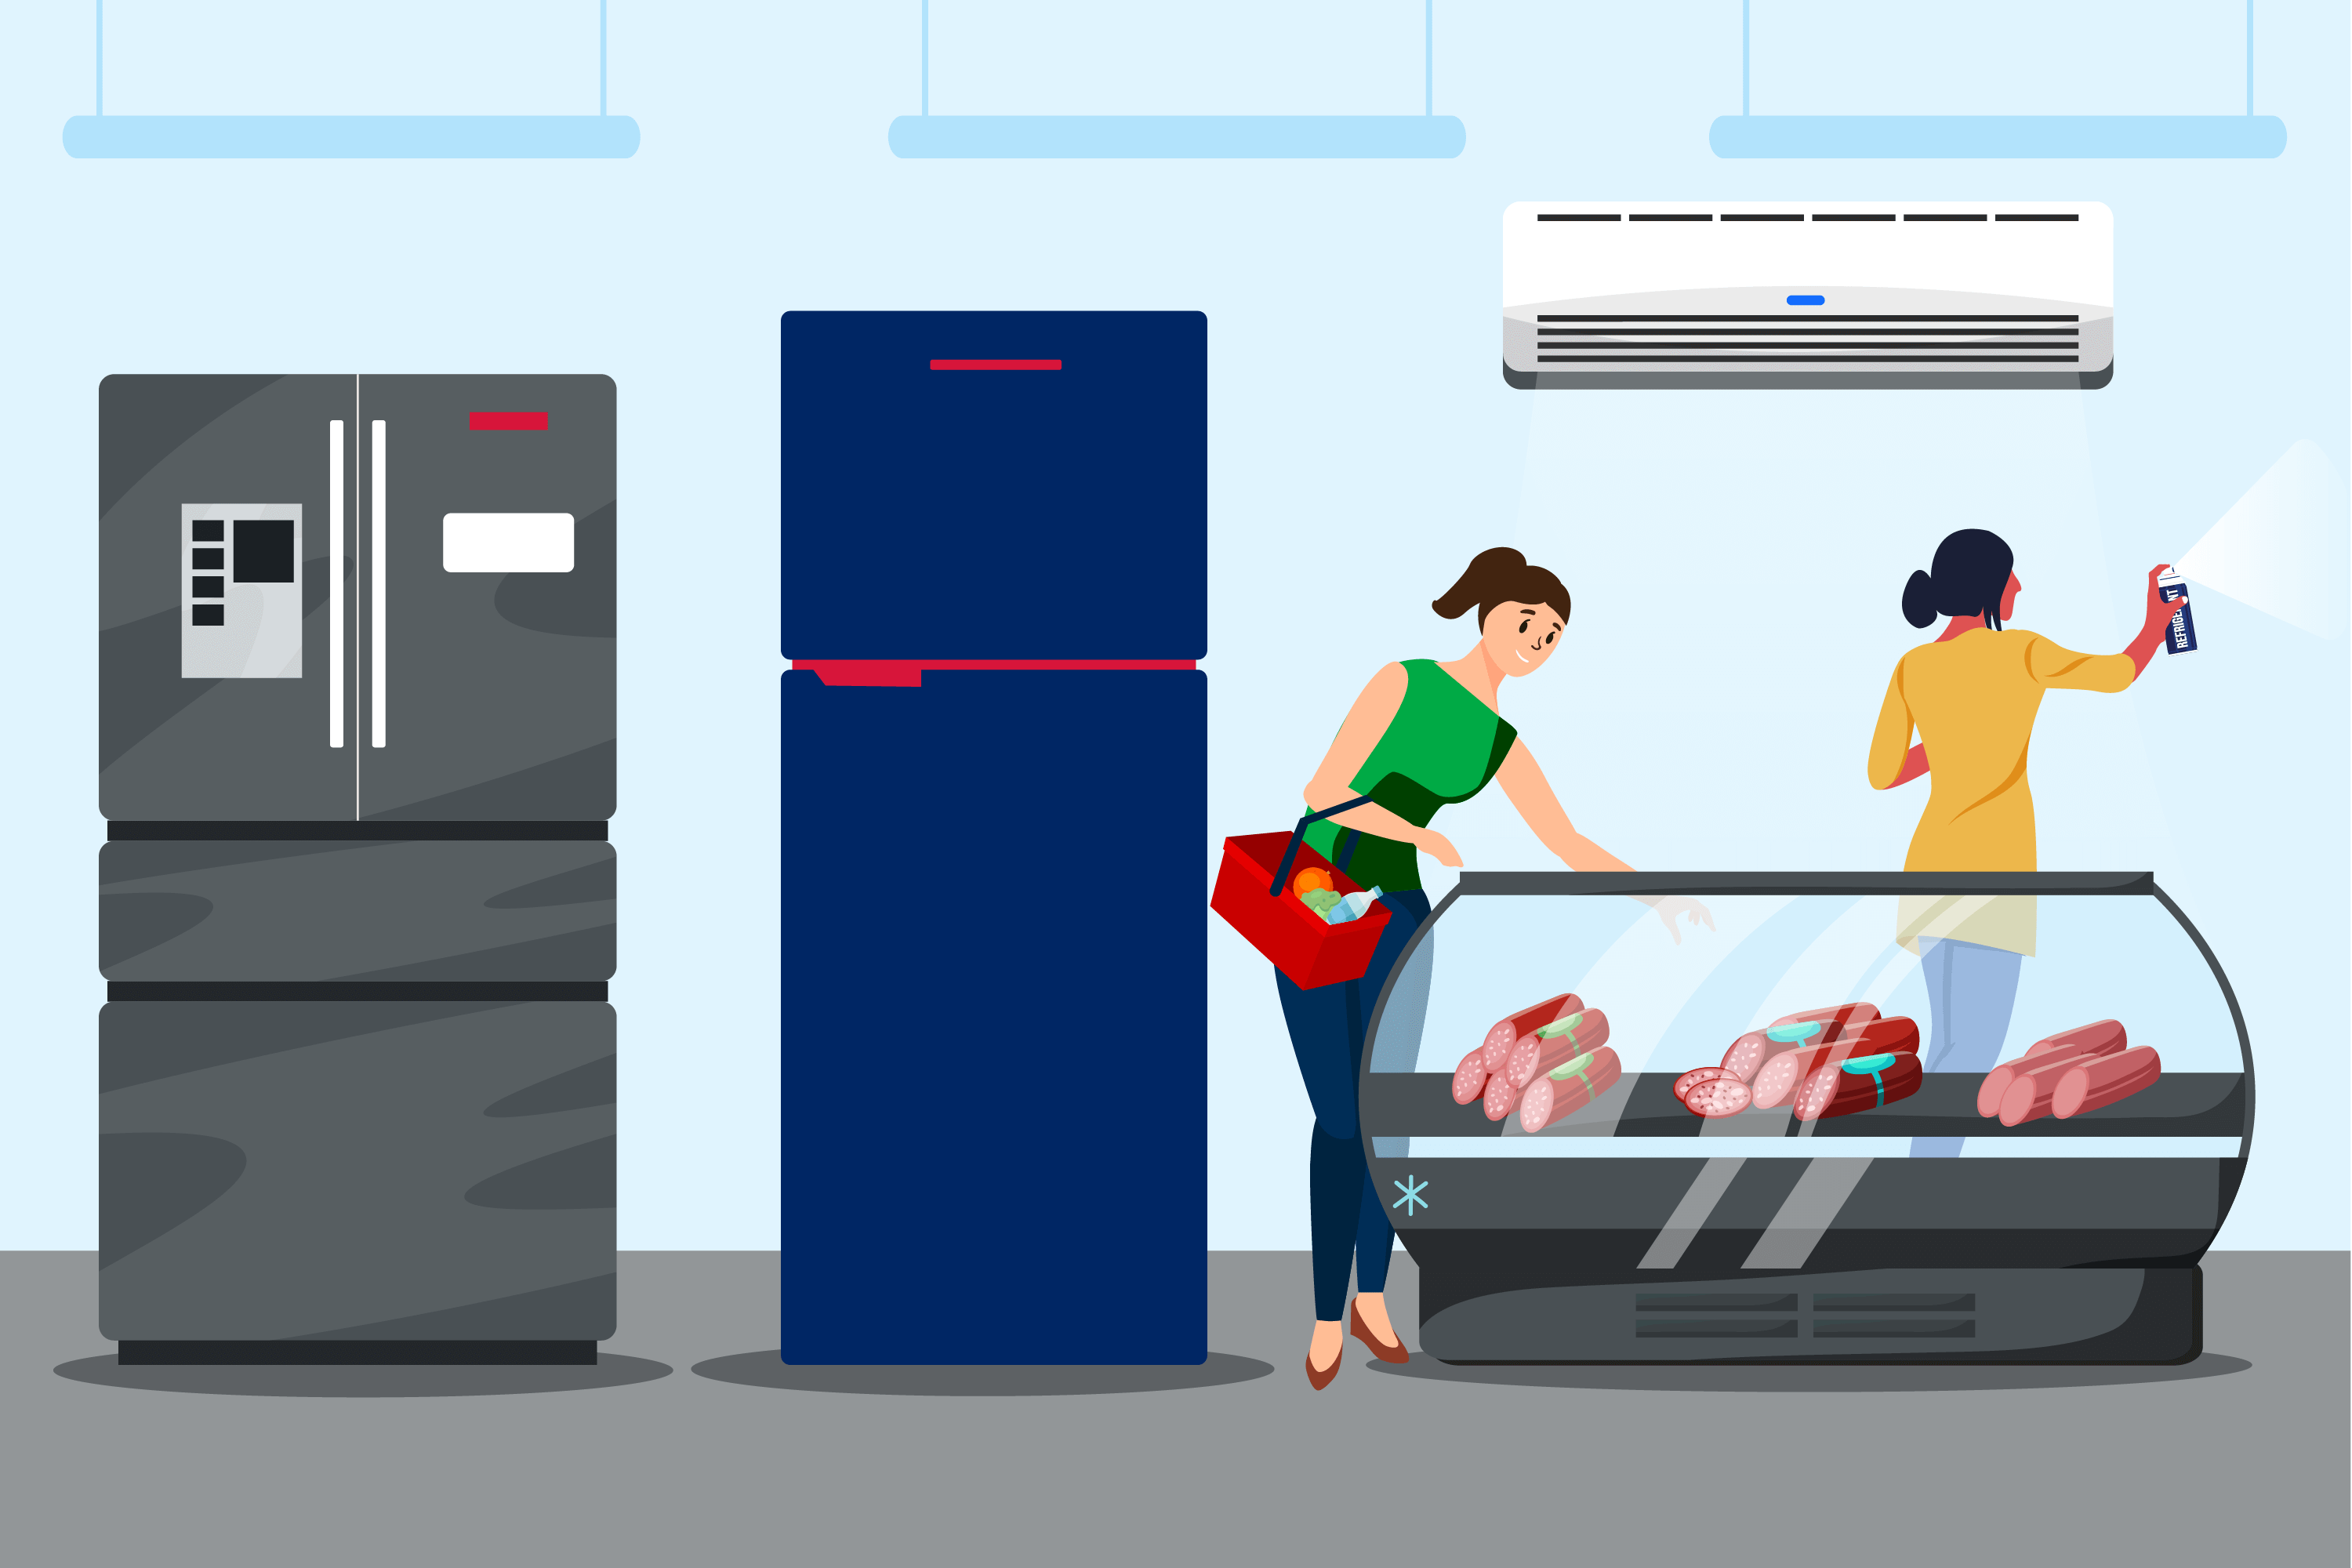
Overall, emissions of these gases have more than doubled (up 112.8%) since 2005, mainly due to increased use of refrigerants in refrigeration and air conditioning.
Source of fluorinated gases
Fluorinated gases come mainly from the manufacture of refrigeration cooling products and aerosols.
Sulphur hexafluoride
Together with fluorinated gases, sulphur hexafluoride (SF6) represents about 3% of NSW emissions.
Impact of SF6
SF6 is believed to be the most potent greenhouse gas with 23,500 times the warming potential of carbon dioxide.
It takes up to 3,200 years to move through the atmosphere, but there are currently only small amounts in the atmosphere.
Sources of Sulphur hexafluoride
Sulphur hexafluoride is used mainly in high voltage electrical equipment and some medical uses.
Sources of these 5 emissions types
The emissions language
When we develop net zero pathways to help organisations reduce their emissions, we plan in terms of direct and indirect emissions and scope 1, 2 and 3 emissions. Individuals and businesses should all be aware of where their emissions are coming from and how they are classified.
Direct emissions are the emissions released directly from your activities to the atmosphere. They are also known as scope 1 emissions. Identifying and reducing direct emissions is usually the first step in any plan to reduce emissions. Residential emissions account for about 13% of NSW's total direct emissions from electricity, gas and transport, and 15% of NSW's scope 2 indirect emissions (from purchased electricity).
Indirect emissions are emissions that are produced outside your home or business, but generated by services you use. For example, when you buy electricity from an external supplier (scope 2 emissions). Indirect emissions also include emissions produced by the people you buy goods and resources from or to transport your goods (scope 3 emissions). It is harder to track indirect emissions, but they can make a significant difference to any net zero plan.
Scope 1 emissions are the emissions released directly from human activities to the atmosphere. They are also known as direct emissions. Scope 1 emissions include those from:
- producing electricity
- manufacturing processes
- transporting materials or people in vehicles owned by the producer
- treating and disposing of waste on-site.
Scope 2 emissions are produced outside your home or business, but produced by services you use (for example, your electricity supplier). Households are the biggest source of scope 2 emissions in NSW.
Scope 3 emissions are directly produced by a business, but are indirectly produced as a result of its operations. They include emissions from supply chain and distribution network, such as emissions from:
- mining raw materials
- the use of a businesses’ products
- waste treatment and disposal
- travel and transporting goods.
For most businesses, scope 3 is the largest share of emissions, but also the most difficult to address.

Government, business and individuals must all play a part, if we’re to reach net zero by 2050. Together is the only way we’ll reach net zero.
From saving energy, using net zero transport or just making smarter buying decisions, there’s plenty of low cost and no cost ways you can reduce your impact